A look at 2D vs WebGL canvas performance
Jan 16 2023 · Web Technologies
I did some quick benchmarking with canvas-image-transformer, looking at the performance between directly manipulating pixels on a 2D canvas versus using a fragment shader on a WebGL canvas. For testing, I used a grayscale transformation as it can be done with a simple weighted sum (R*0.2126 + G*0.7152 + B*0.0722) and there’s a high degree of parity between the fragment shader code and the code for pixel operations on a 2D canvas.
Converting to grayscale
Pixel operations on the 2D canvas are as follows:
for(var i=0; i<pixels.data.length; i+=4) {
    var grayPixel = parseInt(((0.2126*(pixels.data[i]/255.0)) + (0.7152*(pixels.data[i+1]/255.0)) + (0.0722*(pixels.data[i+2]/255.0))) * 255.0);

    pixels.data[i] = grayPixel;
    pixels.data[i + 1] = grayPixel;
    pixels.data[i + 2] = grayPixel;
}
The corresponding fragment shader for the WebGL canvas is as follows:
precision mediump float;

uniform sampler2D uSampler;
varying vec2 vTextureCoord;

void main(void) {
    vec4 src = texture2D( uSampler, ( vTextureCoord ) );
    float grayPx = src.r*0.2126 + src.g*0.7152 + src.b*0.0722;
    gl_FragColor = vec4(grayPx, grayPx, grayPx, 1);
}
Performance comparisons in Chrome
Here’s the setup for comparing performance of the 2 method:
- Input was a 3864×3864 image of the Crab Nebula, rendered onto a 2D canvas (note that time to render onto the 2D canvas is not considered in the data points below)
- Output is the 2D canvas that the input image was render on
- CPU was an AMD Ryzen 7 5700X
- GPU was a RTX 2060
- OS is Windows 10 Build 19044
- Browser is Chrome 108.0.5359.125
- Hard refresh on page load to bypass any browser-level caching
- Transformation via WebGL approach for 25 iterations
- Transformation via 2D canvas approach for 25 iterations
Visually, this is what’s being done:
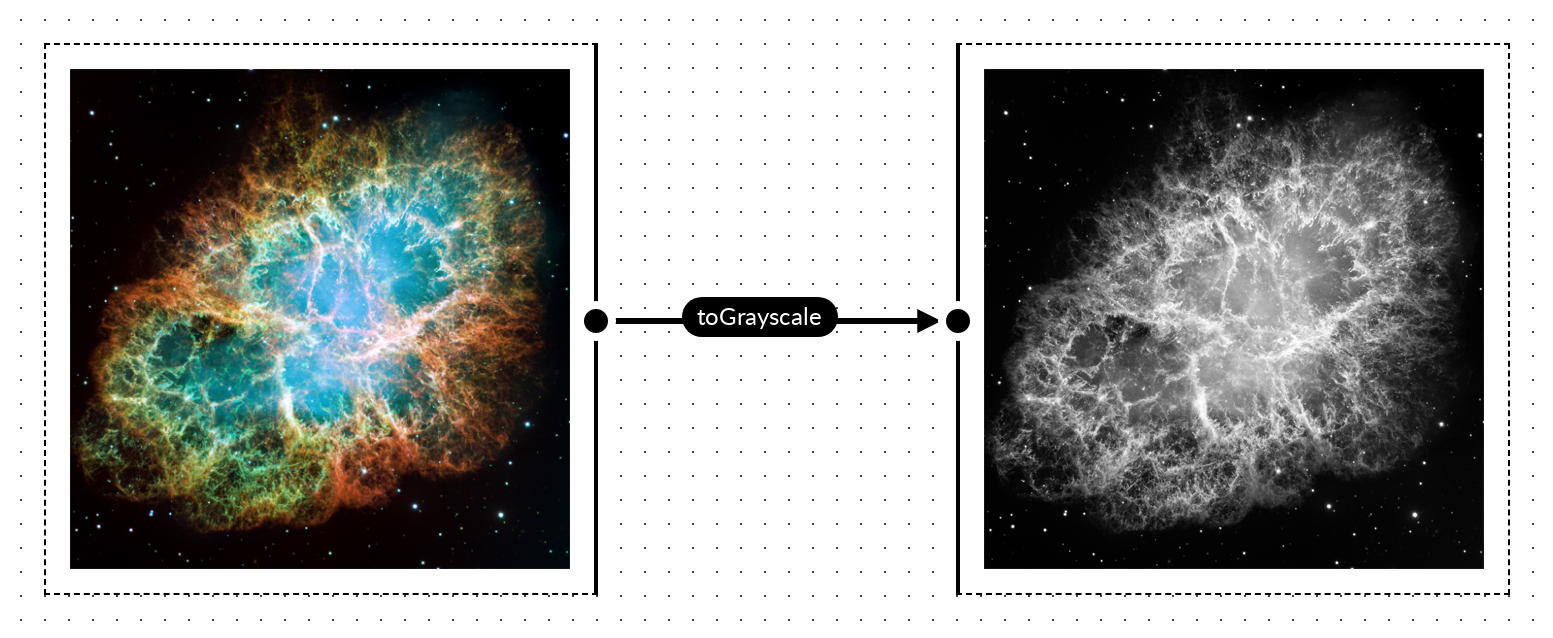
I tried to eliminate as much background noise as possible from the result; that is, eliminating anything that may have a impact on CPU or GPU usage: closing other applications that may have significant usage, not having any other tabs open in the browser, and not having DevTools open when image processing was being done. That said, I was not rigorous about this and the numbers presented are to show overall/high-level behavior and performance; they’re not necessarily representative of what peak performance would be on the machine or browser.
It’s also worth noting that canvas-image-transformer doesn’t attempt to do any sort of caching in the first iteration (i.e. textures are re-created, shaders are re-compiled, etc. on each iteration), so we shouldn’t expect large variances in performance from one iteration to the next.
Graphing the data points for each approach, for each iteration, I got the following (note that what’s presented is just the data for 1 test run; I did test multiple times and consistently saw the same behavior but, for simplicity, I just graphed the values from 1 test run):

So, the data points for the first iteration are interesting.
- On the 2d canvas, the transformation initially takes 371.8ms
- On the webgl2, the transformation initially takes 506.5ms
That’s a massive gap in performance between the 2 methods, with the 2d canvas method being significantly faster. I would have expected the WebGL approach to be faster here as, generally, graphics-related things would be faster with a lower-level GPU interface, but that’s clearly not the case here.
For subsequent iterations, we can see that performance improves and normalizes for both approaches, with significantly better performance using the WebGL approach; however, why don’t we see this sort of performance during the first iteration? Profiling the code, I noticed I was consistently seeing the majority of execution time spent on texImage2D() during the first iteration:
gl.texImage2D(gl.TEXTURE_2D, 0, gl.RGBA8, gl.RGBA, gl.UNSIGNED_BYTE, srcCanvas);
Looking at the execution time of texImage2D() across iterations, we get the following:

We see 486.9ms spent in texImage2D() during the first iteration but then execution time drops to only ~0.1ms in subsequent iterations. It’s clear that loading data into a texture is the most costly operation on the first iteration, however it looks like there’s some sort of caching mechanism, likely in Chrome’s GPU component, that essentially eliminates this cost on subsequent iterations.
In an attempt to optimize the call in the first iteration, I briefly looked into potential optimizations to the texImage2D() call but didn’t find much. There’s no mipmap creation or doing any sort of format conversion here, so we’re just bound by how quickly we can get the pixels into VRAM.
Normal refresh (after previous page load)
There’s a bit more nuance here that’s worth touching on. Looking at just the first iteration in Chrome, after normal/soft refreshes, we see some interesting behavior:

- For the 2d canvas, the first iteration transformation times look the same as when doing a hard refresh
- For the WebGL canvas, we’re getting the transformation times we saw after the first iteration when doing a soft refresh!
It looks like Chrome’s texture caching mechanism is in play and preserves cache entries across soft page refreshes.
What about Firefox and other browsers?
I would expect most Webkit-based browsers would have similar behavior to what’s in Chrome and some quick testing in Edge confirms this.
Firefox is a different beast. Testing in Firefox 108.0.2, we see the following transformation times:

Performance, overall, is much more consistent than in Chrome, but not always better.
- For the 2d canvas method, performance is simply worse; on the first iteration we see transformations take 150+ milliseconds more than in Chrome, and on subsequent iterations the performance gap is even wider.
- For the WebGL method, our first iteration performance is significantly better than Chrome, reduced by more than 175 milliseconds. However, on subsequent iterations we don’t see the drastic performance improvement we see in Chrome.
For the 2d canvas method, it’s hard to say why it performs so differently than Chrome. However, for the WebGL method, a bit of profiling led to some interesting insights. In Firefox, the execution time of texImage2D() is consistent across iterations, hovering ~40ms; this means it performs significantly better than Chrome’s worst case (first iteration) and significantly worse than Chrome’s best case (non-first iteration where execution time is below 0.1ms), as shown below.

The other significant aspect to Firefox’s performance is in the performance of the Canvas drawImage() call, in drawing from a WebGL canvas to a 2D canvas. At the tail end of the transformation process, canvas-image-transformer does the following:
const srcCtx = srcCanvas.getContext('2d');
srcCtx.drawImage(glCanvas, 0, 0, srcCanvas.width, srcCanvas.height);
Basically, it’s taking what’s on the WebGL canvas and writing it out to the input/source canvas, which is a 2D canvas. In Chrome this is a very fast operation, typically less that 2ms, in Firefox I see this typically going above 200ms.

Firefox consistency
Finally, looking at transformation times across soft refreshes, we see Firefox performance is very consistent for both the 2D canvas and WebGL method:

However, I did encounter a case where WebGL performance was more erratic. This was testing when I had a lot of tabs open and I suspect there was some contention for GPU resources.
Takeaways
There’s perhaps a number of small insights here depending on use-case and audience, but there’s 2 significant high-level takeaways for me:
- GPUs are very fast at parallel processing but loading data to be processed and retrieving the processed data can be expensive operations
- It’s worthwhile to measure things; I was fairly surprised by the different performance profiles between Firefox and Chrome


