Performance visibility with HTTP Server-Timing
Dec 23 2018 · Web Technologies
Visibility into the performance of backend components can be invaluable when it comes to spotting and understanding service degradation, debugging failures, and knowing if and where optimization is needed. There’s a host of collection agents, aggregators, and visualization tools to handle metrics, but just breaking down and looking at what happens during an HTTP request can offer a lot of insight into how components are performing. This is why I’m pretty excited about the the HTTP Server-Timing header, it works well as a lightweight mechanism to surface performance metrics, especially now that it’s read and graphed by Chrome Devtools (and, perhaps sometime soon, by Firefox Devtools as well).
An HTTP response with the Server-Timing header
The following code snippet shows an Illuminate/Http/Response from a controller that PUTs an image into an Amazon S3 bucket.
return response()
    ->json(
        [],
        StatusCode::STATUS_OK,
        [
            'Server-Timing' => 's3-io;desc="Image upload to S3";dur=' . calculateTimeToPut(),
        ]
    );
Let’s assume the calculateTimeToPut() function returns 5500 (i.e. 5500 milliseconds to PUT the image onto S3), and the response header looks something like this:

Each metric is a group composed of 3 pieces, with each piece delimited by a semicolon:
- Metric Name (required)
- Metric Description
- Metric Value
Multiple metrics can be surfaced by separating each group with a comma.
return response()
    ->json(
        [],
        StatusCode::STATUS_OK,
        [
            'Server-Timing' =>
                's3-io;desc="Image upload to S3";dur=' . calculateTimeToPut() .
                ',' .
                'db-io;desc="DB update of entity";dur=' . calculateTimeToUpdate()
        ]
    );
(The above code is a bit simplistic, you’d likely want to better way to store and group metrics, then do a final transformation to construct the Server-Timing string when it’s time to send the HTTP response)
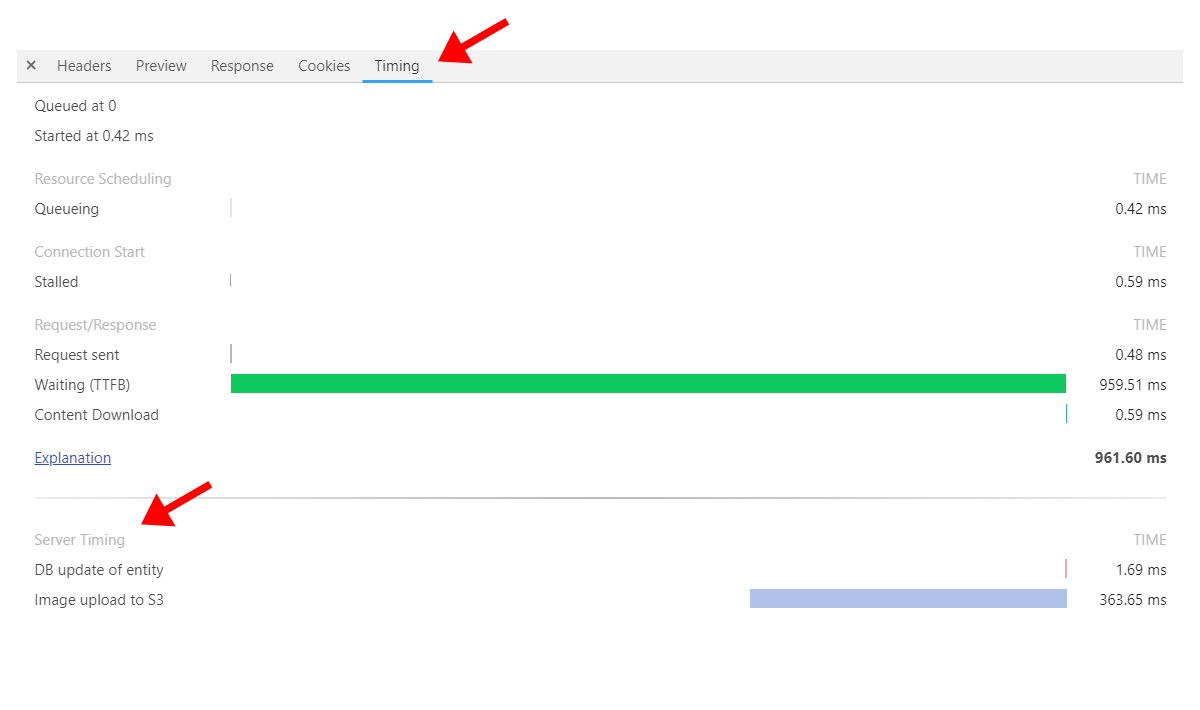
Surfacing in DevTools
Surfacing metrics in an HTTP response is not something terribly complex and I’m sure most could devise other ways to do it, but one reason Server-Timing is a bit more attractive vs a custom solution is the out-of-the-box support within Chrome DevTools.
Firefox Devtools will likely follow suit (hopefully?) in the near future.
The PerformanceServerTiming interface
Server-Timing metrics can also be surfaced via the PerformanceServerTiming interface, from MDN:
In addition to having Server-Timing header metrics appear in the developer tools of the browser, the PerformanceServerTiming interface enables tools to automatically collect and process metrics from JavaScript.
This opens up some interesting possibilities as it enables collecting metrics via a frontend script (as is already done for a lot of product metrics via services like Google Analytics), rather than a backend collector mechanism. While not ground-breaking, the standardization around PerformanceServerTiming may allow for greater adoption and acceptance of this collection pattern.


